The EQTrace Earthquake Atlas is an interactive application that displays selected earthquake events from the publicly-available United States Geological Survey (USGS) on-line repository. You enter search criteria, optionally including a designated geographic area, and the results are presented on a 2-dimensional map or a 3-dimensional globe. EQTrace provides both a static display and a simulation capability; the simulator displays the selected events in time order.
The data source is the USGS Earthquake Catalog portal, which provides access to all Earthquakes maintained in the USGS database, dating from January, 1900 to the present.
Access EQTrace from a Web Browser
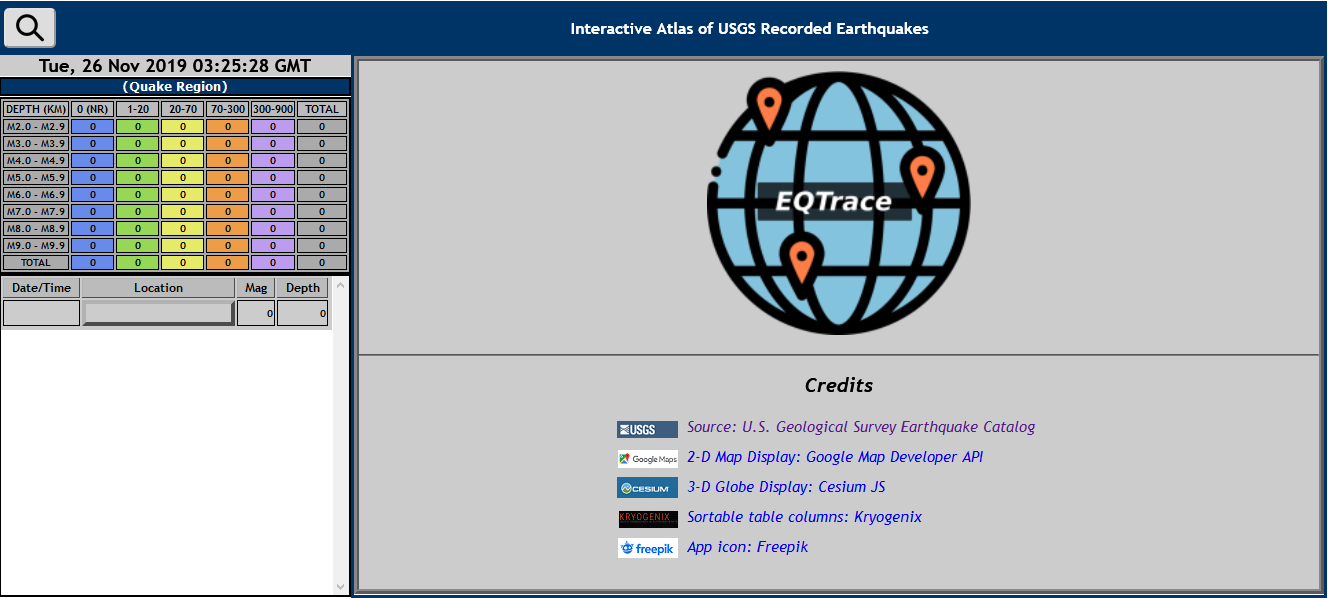
Access EQTrace from any standard web browser by navigating to http://www.pnautilus.net/apps/EQTrace/index.html. The initial page looks as follows:
Initial Display Screen (tablet, laptop or desktop)
If accessing the app from a small screen device (e.g., mobile phone or tablet), the initial display appears as follows:
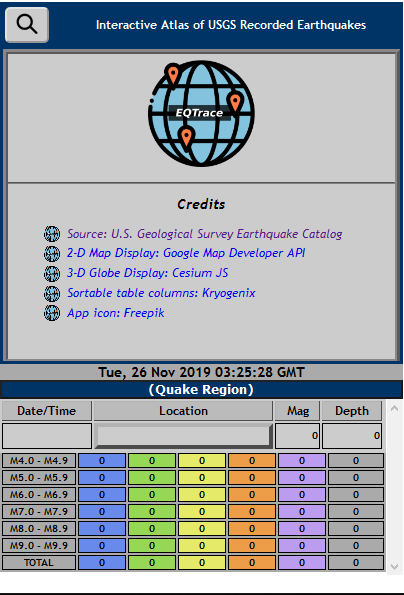
Initial Display Screen (Mobile Device)
You can download and install the EQTrace app on your desktop or mobile device because it supports the key features of a Progressive Web Application (PWA). Modern web browsers are beginning to provide basic support for PWAs.
A PWA looks and behaves like a true Web App:
EQTrace App Icon
The Google Chrome browser allows PWA installation through the "Customize and Control Chrome" icon on the browser address bar: click "Install EQTrace Application?" and then click Install when prompted.
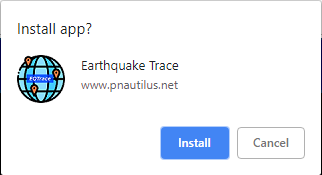
EQTrace Install Prompt
The EQTrace app is available for free from the Microsoft App Store; visit the Download Page.
EQTrace can be installed on Apple iOS devices such as an iPad through the "Add to Home Screen" option in the Safari browser. EQTrace can also be installed on Android mobile devices. When you navigate to the app home page, you will receive an "Add To Home Screen" prompt. Clicking the Install option downloads the app onto your mobile device; it can be launched by clicking the icon just like any other mobile app, and managed through the Settings > Apps menu.
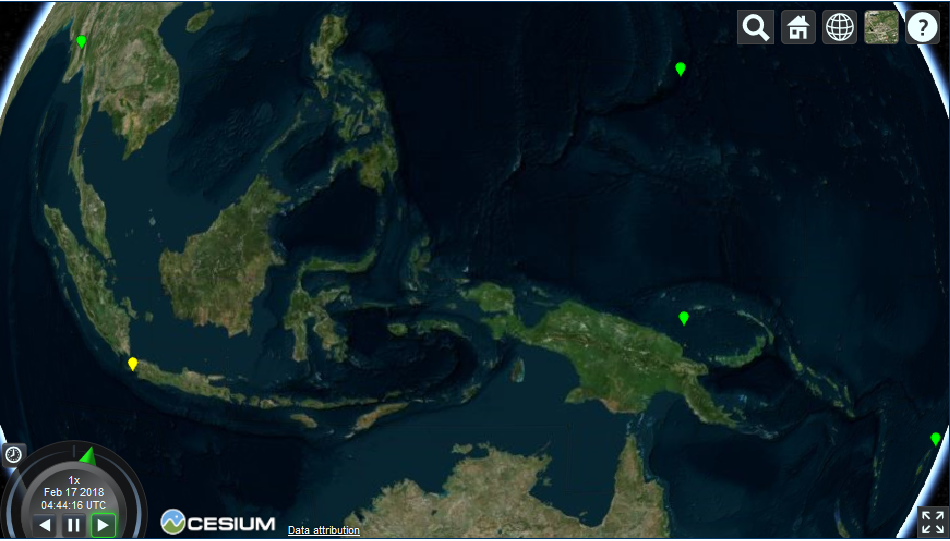
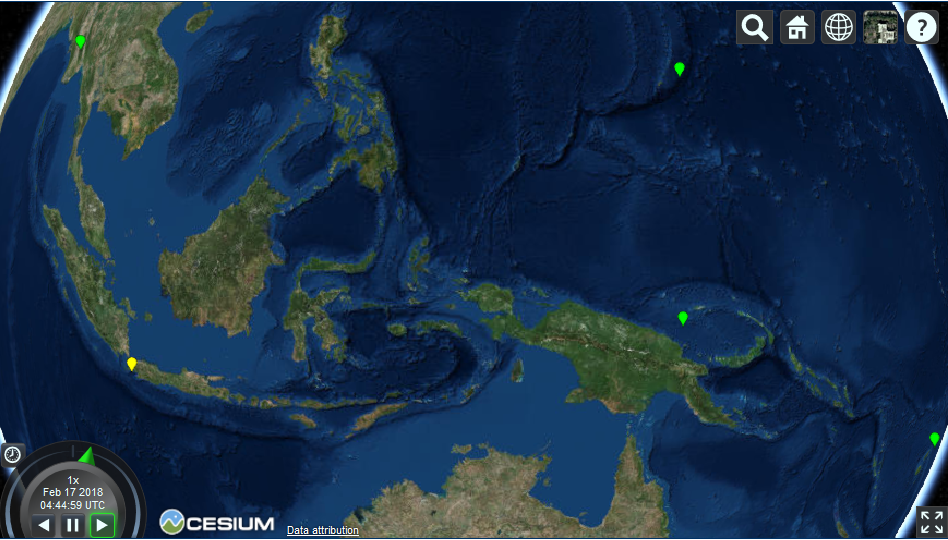
You can view quake results on either a three-dimensional Cesium globe (default) or a two-dimensional Google map, as shown in the following examples. Note that in the 3D examples that follow, the Bing Maps Aerial imagery server is selected. (Use the Imagery menu button in the top right area of the globe display to select an imagery overlay).
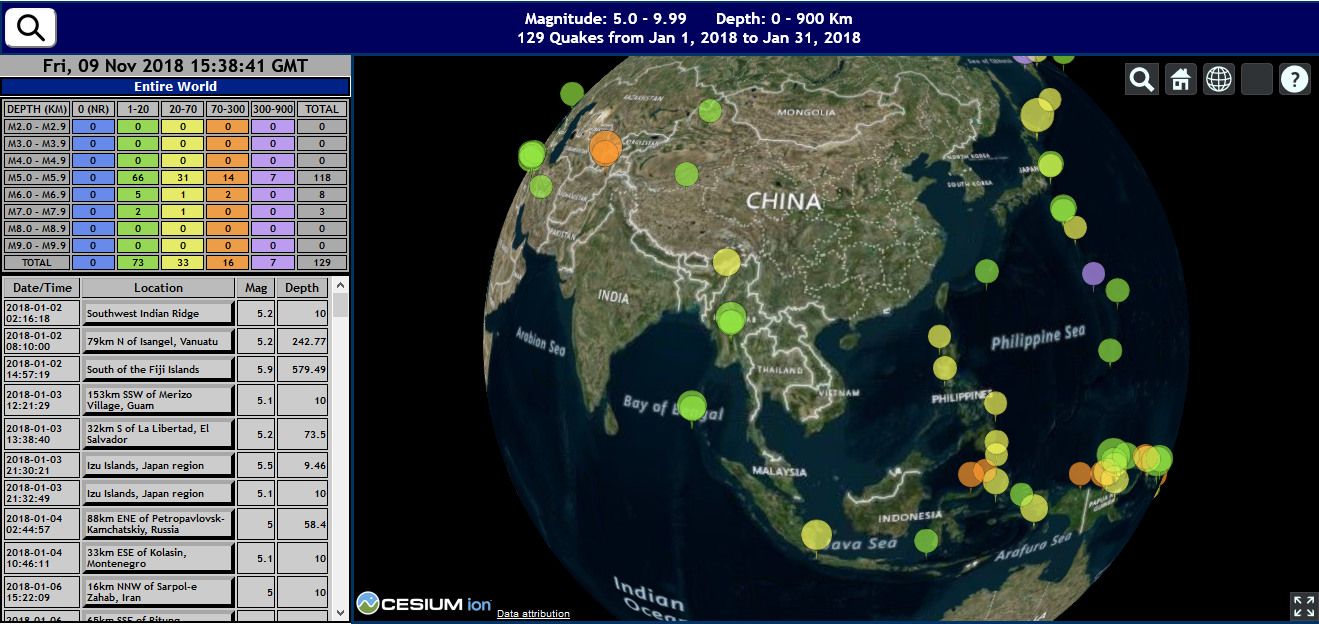
3-D Display example - results displayed on a Cesium Globe
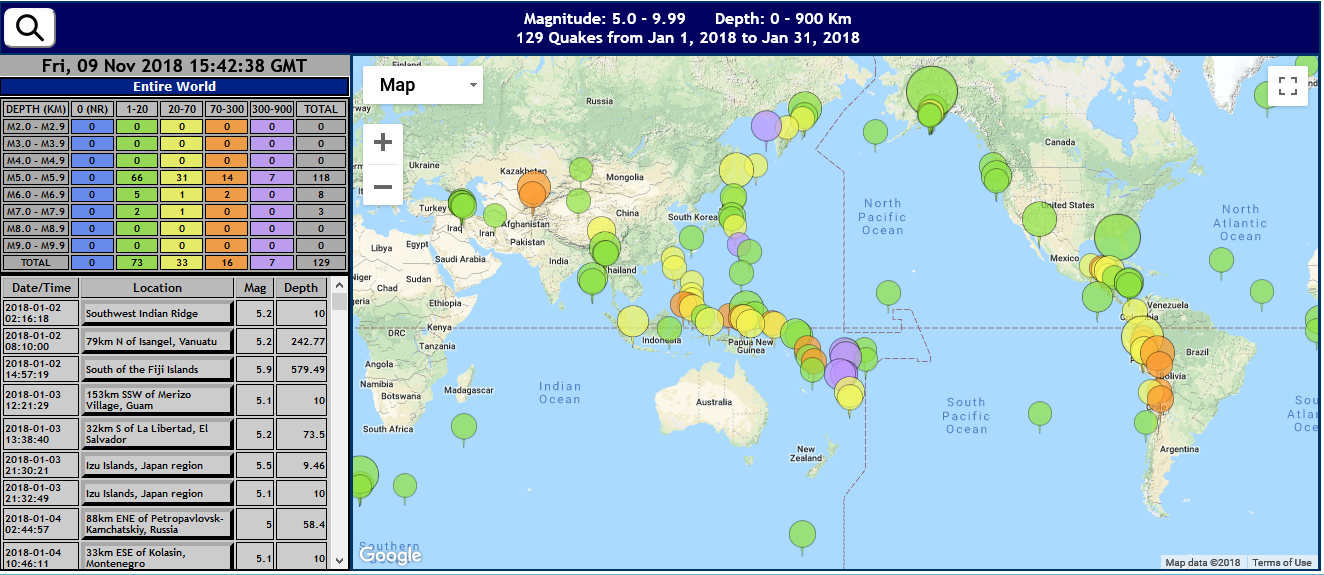
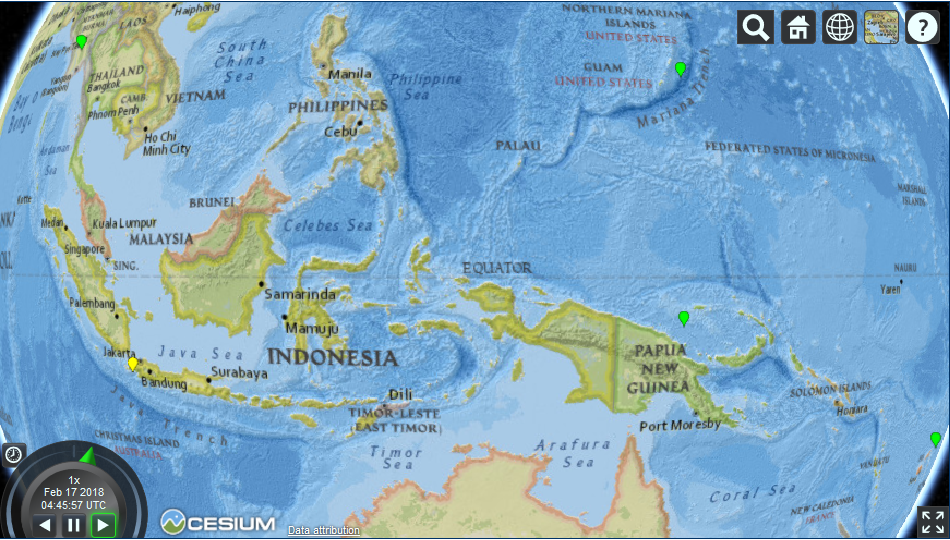
2-D Display example - results displayed on standard Google Map
Example 3D Regional display, zoom-in to Volcano National Park, Island of Hawaii, showing the massive number of minor volcano-triggered quakes at or near the surface, occurring in a four-month interval in 2018:
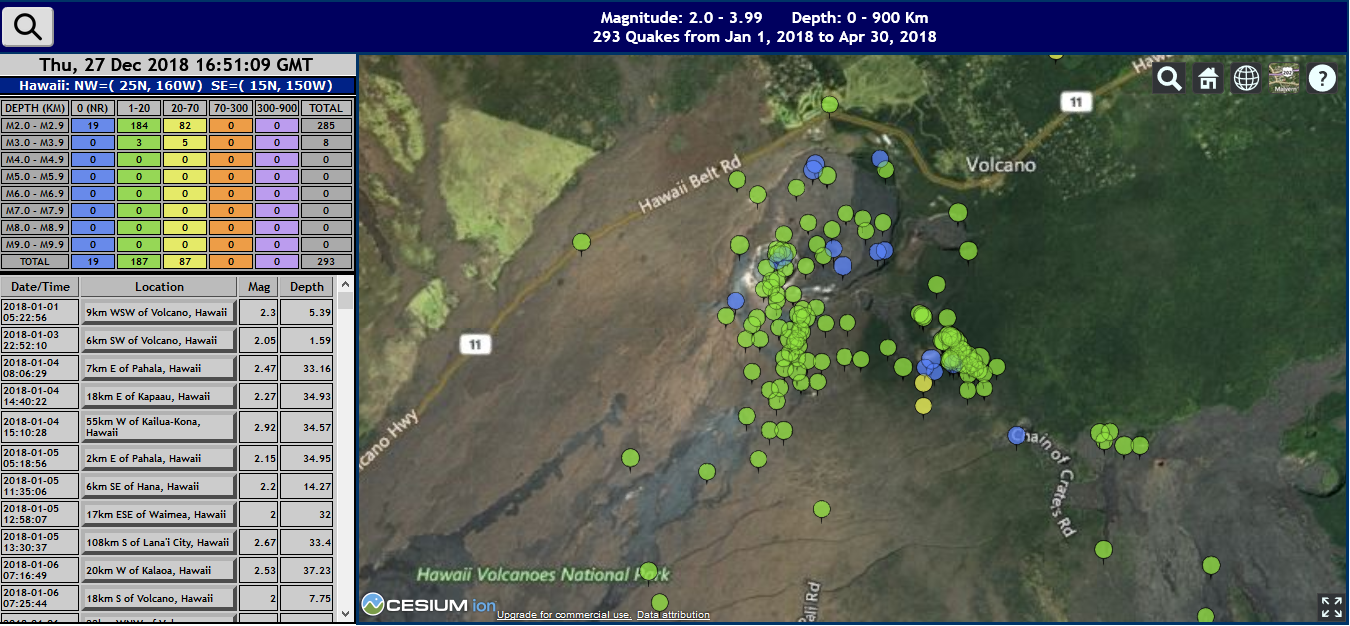
3-D Display example - Volcano National Park, near-surface quakes from volcanic activity
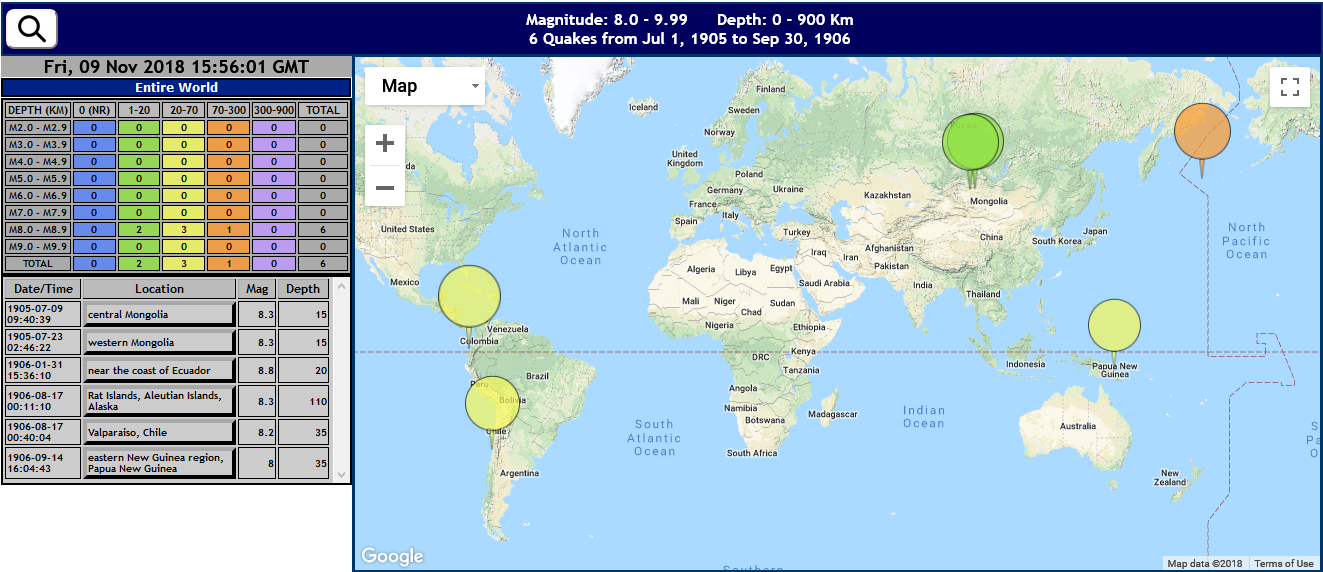
Here is an interesting snapshot: This example shows that between July 9, 1905 and September 14, 1906, a time span of less than 15 months, the earth was subjected to no fewer than six temblors of magnitude 8 or greater, an unprecedented set of events in such a short time span. Note that this set does NOT include the "great" San Francisco Earthquake of April 18, 1906, which is officially listed as magnitude 7.8!
Use the Menu to define your earthquake search parameters. Click the Search button  in the Title bar to toggle the Menu:
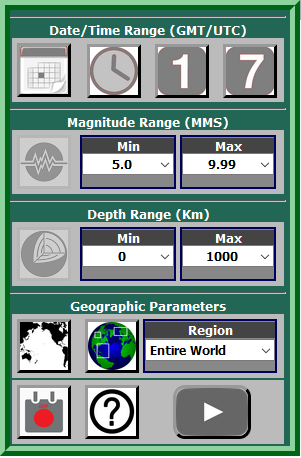
Initial Menu
From top to bottom, the menu icons and inputs are:
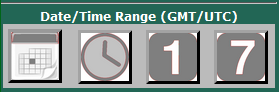 |
Date/Time Range Selector Panel. Click the Calendar image to display the date range selector (see next row). Click the Clock, Day, or Week image to select previous hour, day, or week, based on the current date/time (see the succeeding three rows). Clicking any image activates the Go button. |
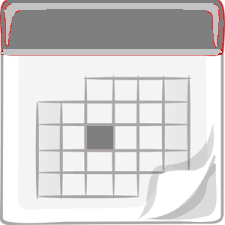 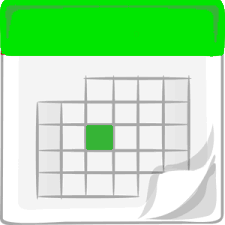 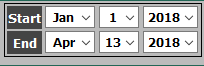 |
Date Range Selector. Click the Grey calendar icon; the icon turns green and the Start/End Calendar is displayed, allowing you to pick a start date and end date. |
  |
Previous Hour Selector. Click the grey Clock icon to display earthquakes recorded in the last hour. The icon turns green on selection. |
  |
Previous Day Selector. Click the grey "1-Day" icon to display earthquakes recorded in the last 24 hours. The icon turns green on selection. |
  |
Previous Week Selector. Click the grey "7-Day" icon to display earthquakes recorded in the last 7 days (168 hours). The icon turns green on selection. |
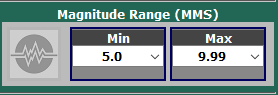 |
Magnitude Selector Panel. Select the desired minimum and maximum Magnitude range. Values are in the Moment Magnitude Scale (M2.0 to M9.99). Default is M6.0 - M9.99. |
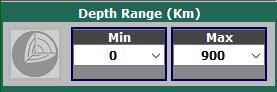 |
Epicenter Depth Selector Panel. Select the desired minimum and maximum Depth range. Values are in Kilometers (0 - 900 Km). Default is 0 - 900 Km. |
  |
Display Format Toggle. Toggle the image to select the desired display format, either a 2D Google map or a 3D Cesium globe. |
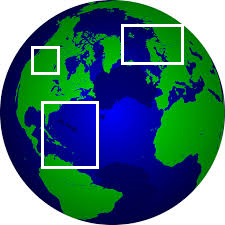  |
Region Type Toggle. Toggle the image to select either a predefined geographic region or a custom geographic region of interest. The predefined region is selected from a drop-down list; the default is the entire world. The custom region is defined by dragging and resizing a selection rectangle on a Google map, as explained below. |
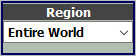  |
Region Selector/Identifier. If the Region Type is predefined, choose from a number of geographic regions, expressed in terms of minimum and maximum Latitude/Longitude. If the Region Type is custom, the custom geographic coordinates are displayed. Details are provided below. |
   |
Static/Simulation Toggle. Toggle the image to select either a static display (all data is displayed upon retrieval) or a time-based user-activated simulation (data is displayed chronologically, in order of occurrence). The simulation may be run either in fast or slow mode. Considerations for running a simulation are given below. |
 |
Help. Click this button to toggle a Quick Help screen. Topics are accessed by clicking the green topic header. Successively clicking the topic header expands and elides the topic text. You can access this help document by clicking the DETAILS button on the Quick Help screen. |
  |
Run Query. This button is disabled (grey) until you select one of the Date/Time buttons (Calendar, Hour, Day, or Week) at the top of the menu screen. |
Menu Details
Notes:
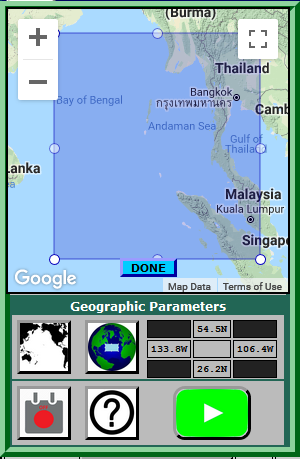
| Toggle the Region Type selector to select the Custom Geographic Range icon: |
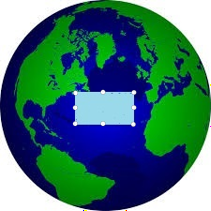
A Custom Region Selection panel appears on top of the upper portion of the menu screen. The panel contains a Locator Map with a small blue selector rectangle positioned with respect to the center of the current map or globe display. The selector rectangle contains eight white resize handles that allow you to position it over the desired geographic region:
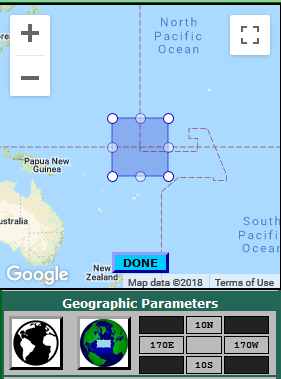
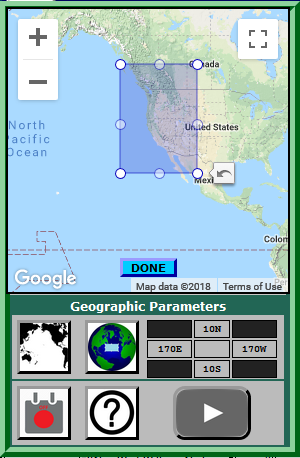
Custom Region Selection using Locator Map (Initial and Final)
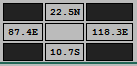
Manipulate the selector rectangle by dragging it (hold the left mouse button down anywhere inside the rectangle) and resizing it using any of the eight resize handles. Once you have the rectangle over the desired geographic area, click the DONE button. The Custom Region Selection Panel closes and the region boundary coordinates are updated on the Geographic Parameters panel. The Region Boundary Coordinates display shows the boundaries of the search region - North Latitude at the top, West Longitude at left, East Longitude at right, and South Latitude at bottom. Search results are restricted to the designated geographic area only.
Custom Region Boundary Coordinates Display
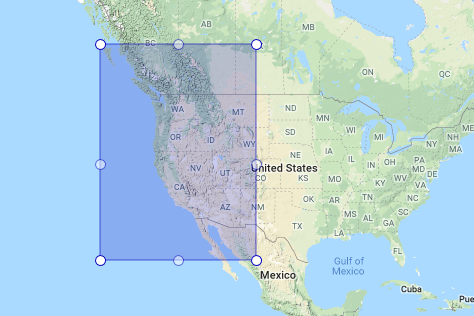
Using Custom Region Selection to define a region (left) and the resulting data (right)
Hints: Pan and/or zoom the map or globe to the approximate desired geographic area before selecting the Custom Region option. Click the Full Screen View icon on the Locator Map to more easily select the region of choice; press the Escape key on your keyboard to return to the original view. You can refine the custom region by clicking the Region Type selector twice; the first click returns to the Predefined Regions list, the second click displays the Locator Map with the selector rectangle at the center of the last iteration.
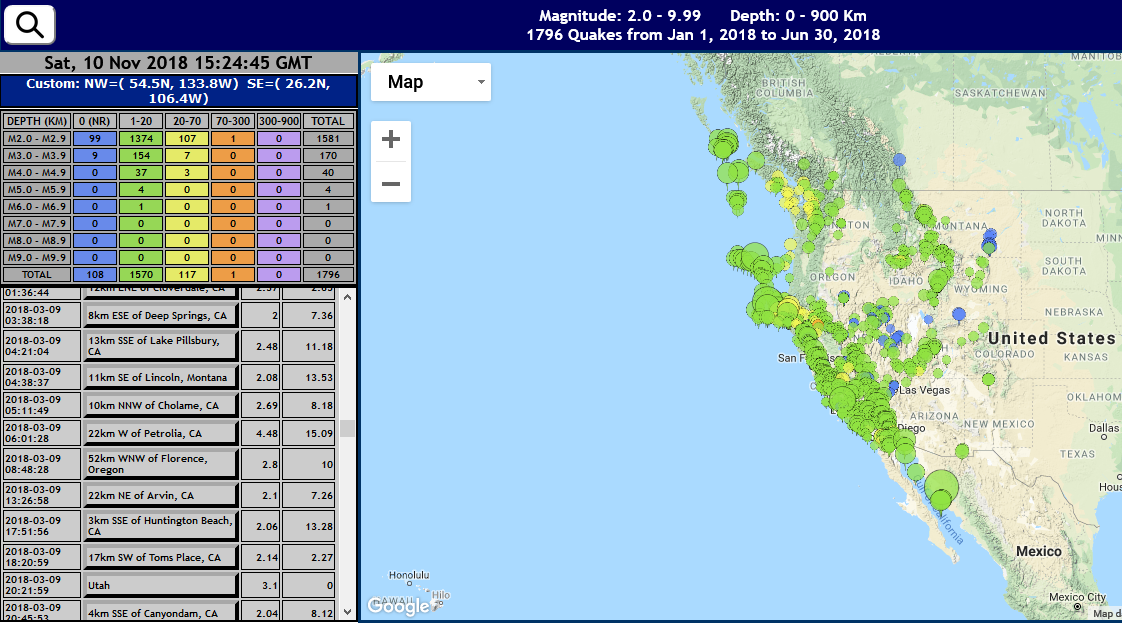
EQTrace Results
EQTrace Search results are displayed in four areas of the screen:
All Quake events that match the criteria you select from the menu are displayed in summary and tabular form and are displayed on the Google map or Cesium globe (note - latitudes above 80oN and below 80oS are not covered). The query retrieves a maximum of 2500 quakes.
The app title bar displays a summary of the query and results including the magnitude range, depth range and date range, and the number of quakes meeting the query criteria.

Query Summary
The top left panel displays the Date/Time that the query was run, in UTC format (that is, query time is expressed as Greenwich Meridian Time), and the geographic region. If the region is predefined (e.g. Hawaii, in the example) it is shown. If the region is custom, the Northwest and Southeast coordinate points are displayed.

Query Date/Time and Geographic Region
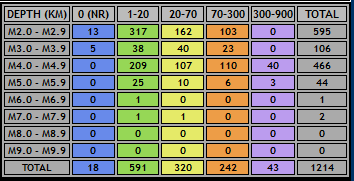
The Summary table lists the number of Earthquakes by Magnitude and Depth, as shown:
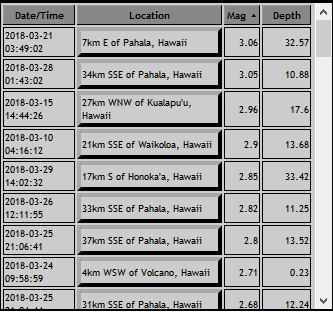
All earthquake events that satisfy the search parameters are listed in the Earthquake List in the lower left panel of the display. Event details include the earthquake date-time of occurrence, location, earthquake magnitude on the Moment Magnitude Scale, and epicenter origin depth (hypocenter). The quake list rows are sortable - simply click the column header of the appropriate column. Clicking a second time reverses the sort.
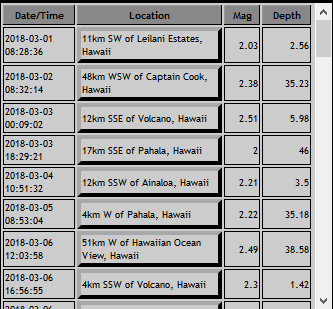
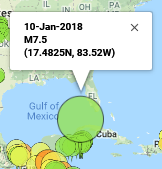
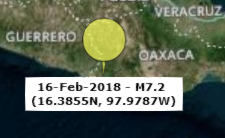
The location column is made up of clickable buttons. Clicking a location button identifies that particular earthquake location on the map, using an Information pop-up. Conversely, clicking an earthquake marker on the map or globe displays the pop-up and highlights the quake in the Earthquake List.
The earthquake events that match the search criteria are positioned on the map or globe using colored icons (markers). The size of the icon indicates the magnitude on the Moment Magnitude (MMS) scale in accordance with the formula:
| Icon Size (pixels) = (Magnitude)2 + 20px |
Thus a magnitude 2 earthquake is represented by an icon 24 pixels tall (including the pin point), while a magnitude 9 earthquake is 101 pixels in height. On the MMS scale, a one-magnitude increase or decrease represents a 32-fold increase or decrease in the energy of the quake.
The color of the icon indicates the earthquake epicenter depth in kilometers from the surface of the earth. A depth of 0 typically implies that the depth is unknown or not recorded. Note that these same colors and ranges are used in the Earthquake Summary table.
| D=0 Km | D=1-20 Km | D=20-70 Km | D=70-300 Km | D=300-900 Km |
|---|---|---|---|---|
 |
 |
 |
 |
 |
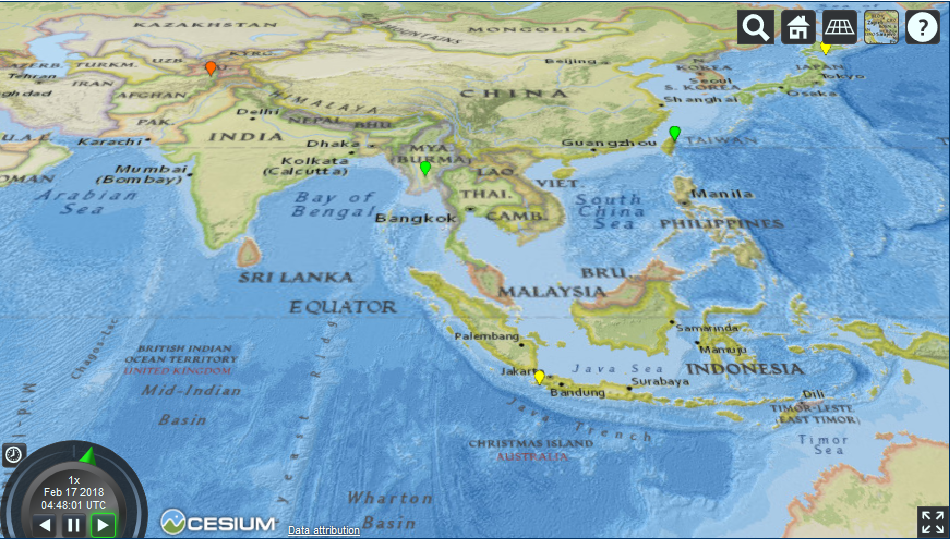
You can use the built-in features of Google maps to customize the map display, for instance, toggling between Map and Satellite perspectives:
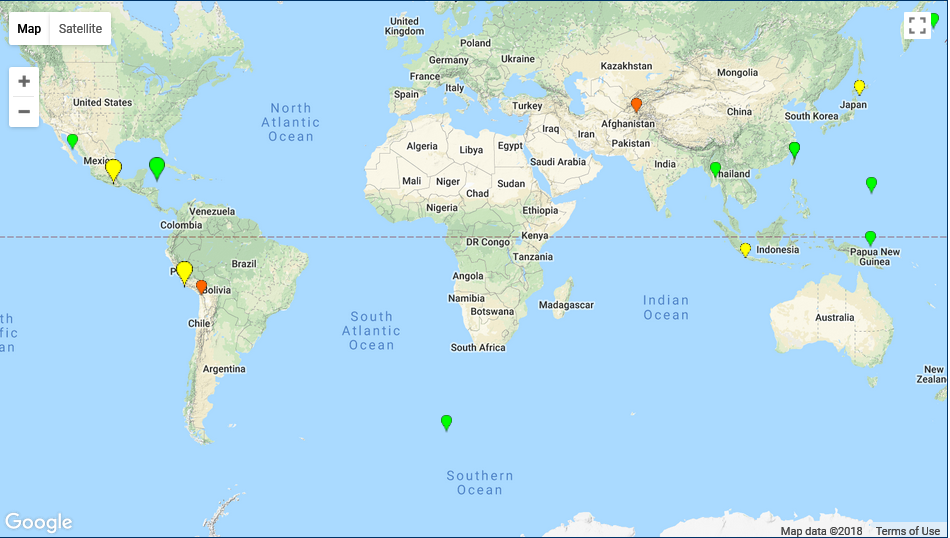
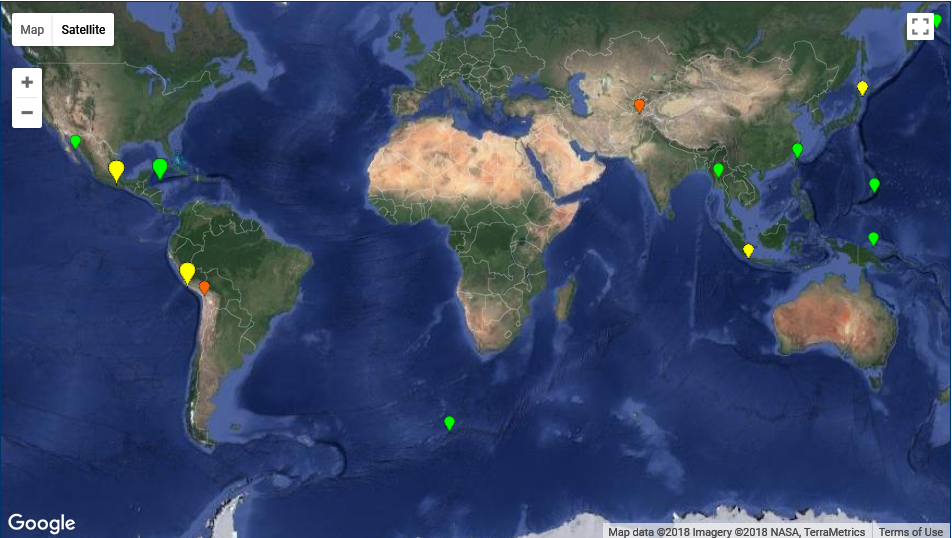
Customized 2-D Displays - Map (Left) and Satellite (Right)
Similarly, the Cesium Globe toolbar allows you to change the Globe tile overlays:
Customized 3-D Displays - Bing (Top Left), ESRI (Top Right), National Geographic (Bottom Left), Columbus (Bottom Right)
To run a simulation, toggle the Static/Simulation icon to the desired setting:
|
Runs a SLOW simulation. |
|
Runs a FAST simulation (5x the SLOW simulation rate). |
Simulation rates are based on the time difference between the end and start date/times:
| Date/Time Difference |
SLOW Simulation Rate (Relative) |
| 0 to 1 hour (used for a Previous Hour query) | 0.3 |
| One hour to one day (used for a Previous Day query) | 1.0 |
| One day to seven days (used for a Previous Week query) | 6.0 |
| Seven days to 30 days | 10.0 |
| 30 days to 360 days | 25.0 |
| More than 360 days | 100.0 |
There are several things to consider when performing a simulation run:
Example: The following query runs a simulation of events leading up to and following the great M9.1 earthquake that struck Sumatra and the nearby Andaman Islands in December, 2004. In this case, a custom geographic region is identified (left), the date range and fast simulation are specified (right):
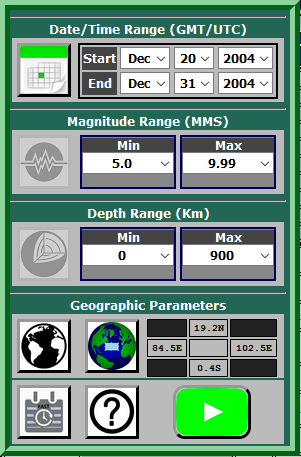
Sample Simulation Query Parameters and Custom Region Selection
Click the green Go button to retrieve the query results. The app displays the list of quakes that match the query criteria, and focuses the globe or map on the geographic region of interest. The timer Clock or Calendar, in this case, is displayed at the top of the map area, with the READY indicator showing. Clicking this indicator begins the simulation, with the indicator running through the following updates:
| READY | Simulator is ready to run (click to start) |
| RUNNING | Simulator is running (click to HALT) |
| DONE | Simulation is complete (click to reset to the READY state) |
| HALT | Manual halt while running (click to re-start) |
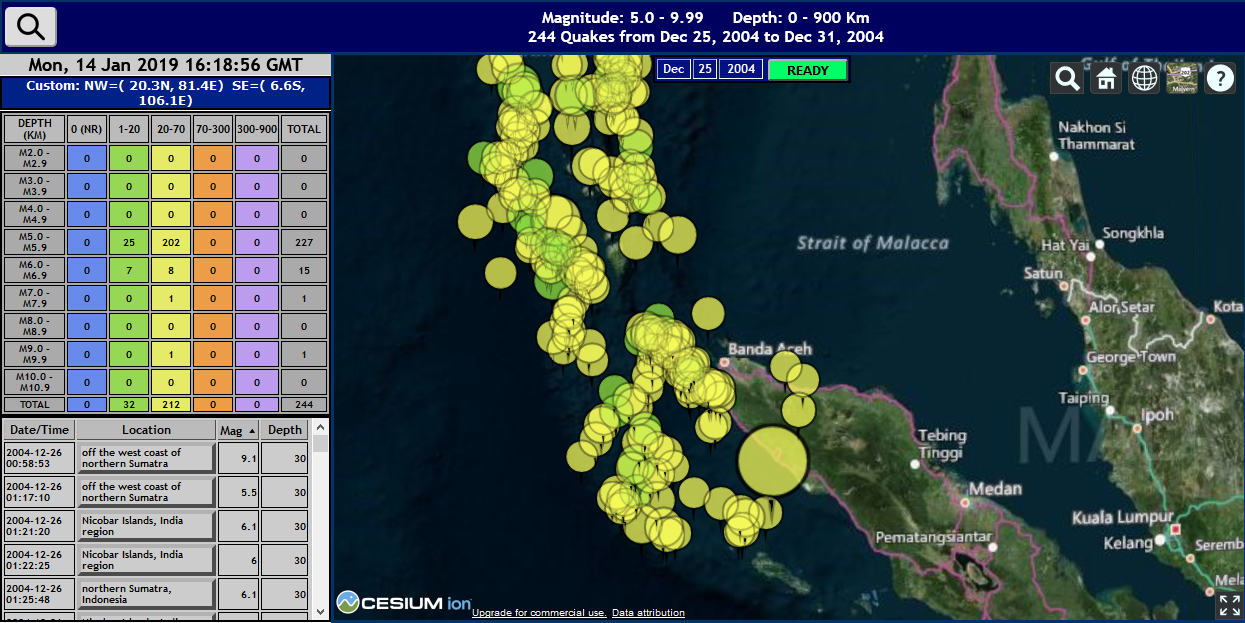
Initial Simulation Screen for Sumatra 2004 Quake and After-shocks
Examine the quake list to refine the query parameters if desired. For example, since the first quake within the specified calendar range doesn't occur until December 26, it may be better to reset the query start date to begin the simulation run on December 25 or 26 instead of December 20. Zoom/pan the globe or map to refine the geographic region as necessary. And running the simulator in SLOW mode would allow a clearer indication of events as they occur. When you are satisfied that the simulator is properly set, click the READY indicator to begin the simulation.
As the calendar or clock advances, each successive quake is highlighted in red at the simulation date/time that it occurs. When the next quake occurs, the quake marker is restored to its original color.

Current quake is highlighted in red
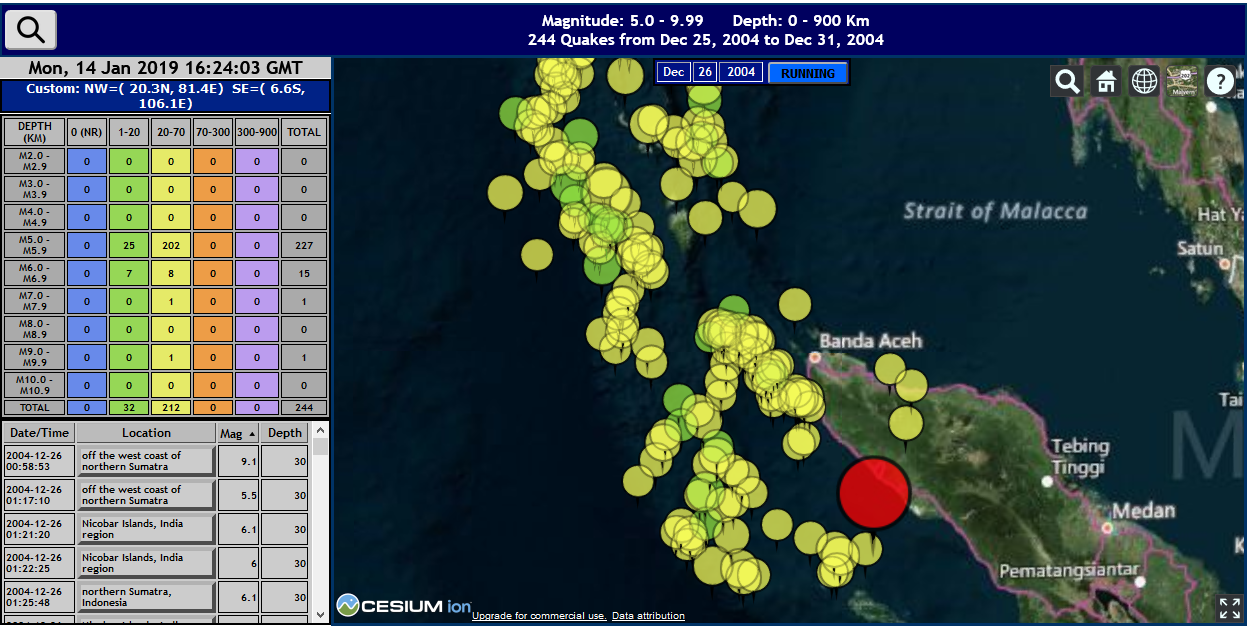
Simulation Running - initial M9.1 Quake occurs
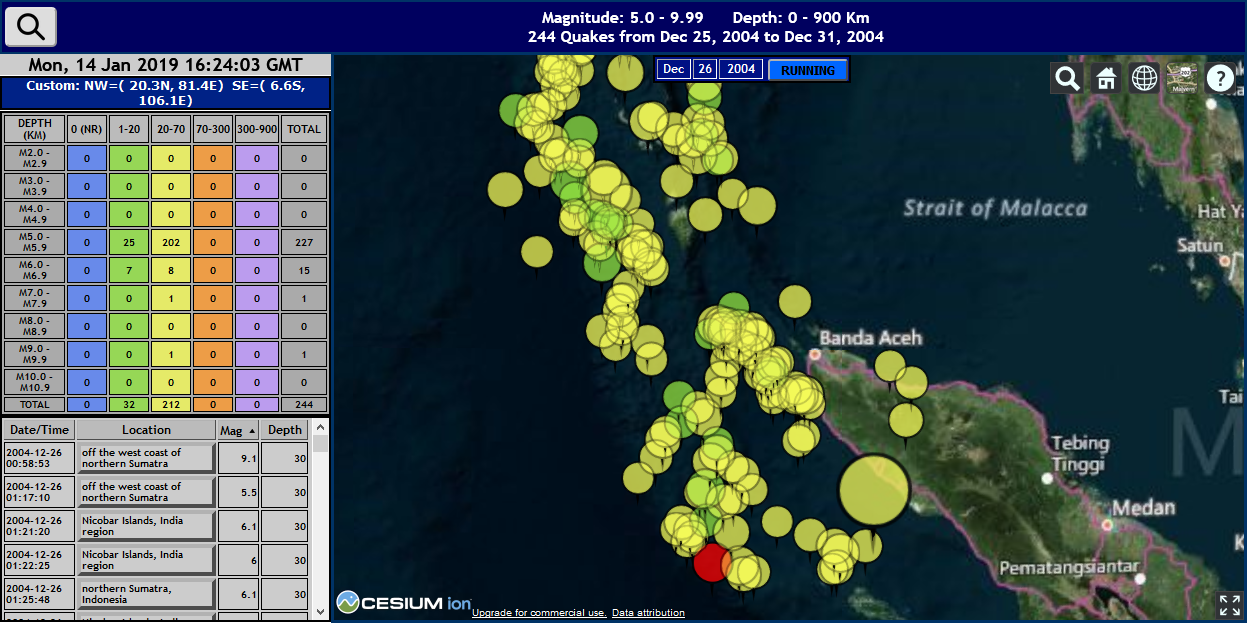
Simulation Running - Aftershocks snapshot
After the simulation completes, all quakes are shown as they would in the corresponding static display. The end result of the Sumatra simulation looks as follows:
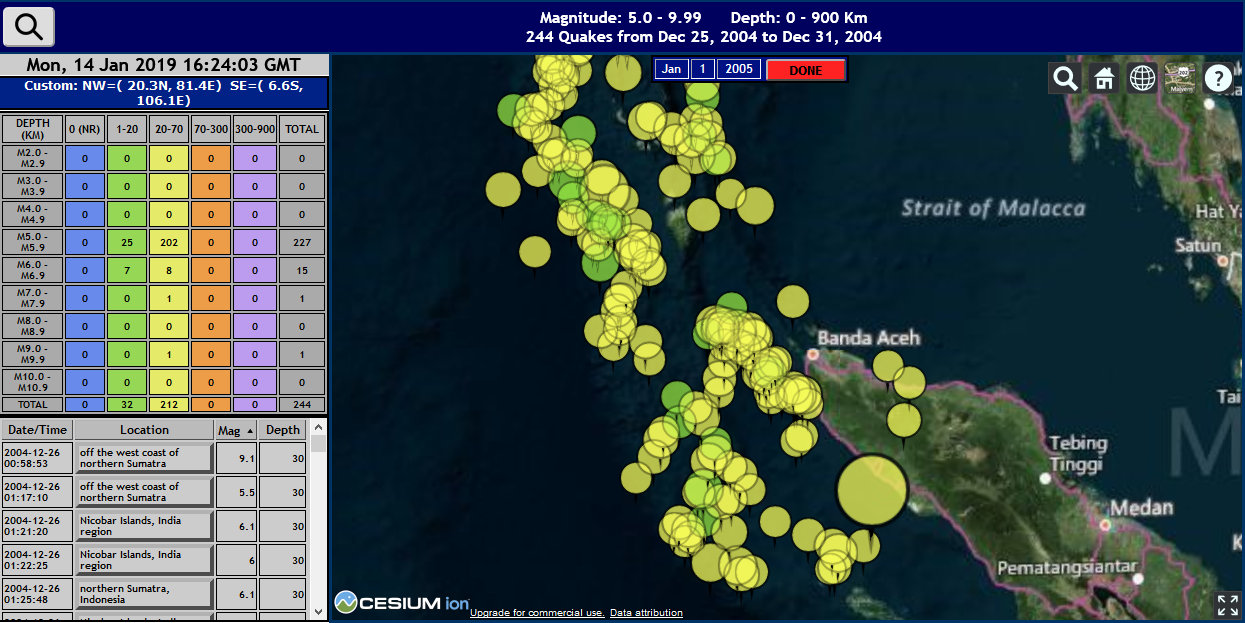
Final Simulation Screen
Yes, 138 after-shock quakes of magnitude 5 or greater occurred within the 24 hours following the initial major temblor, and over 100 additional quakes occurred within the next five days! The fault line is evident in the quake locations.
Zoom in for a closer inspection. Observe on the earthquake list that the initial quake, and most of the follow-on shocks, all occur around 30 km below the surface, indicating that the fault scarp was relatively level:
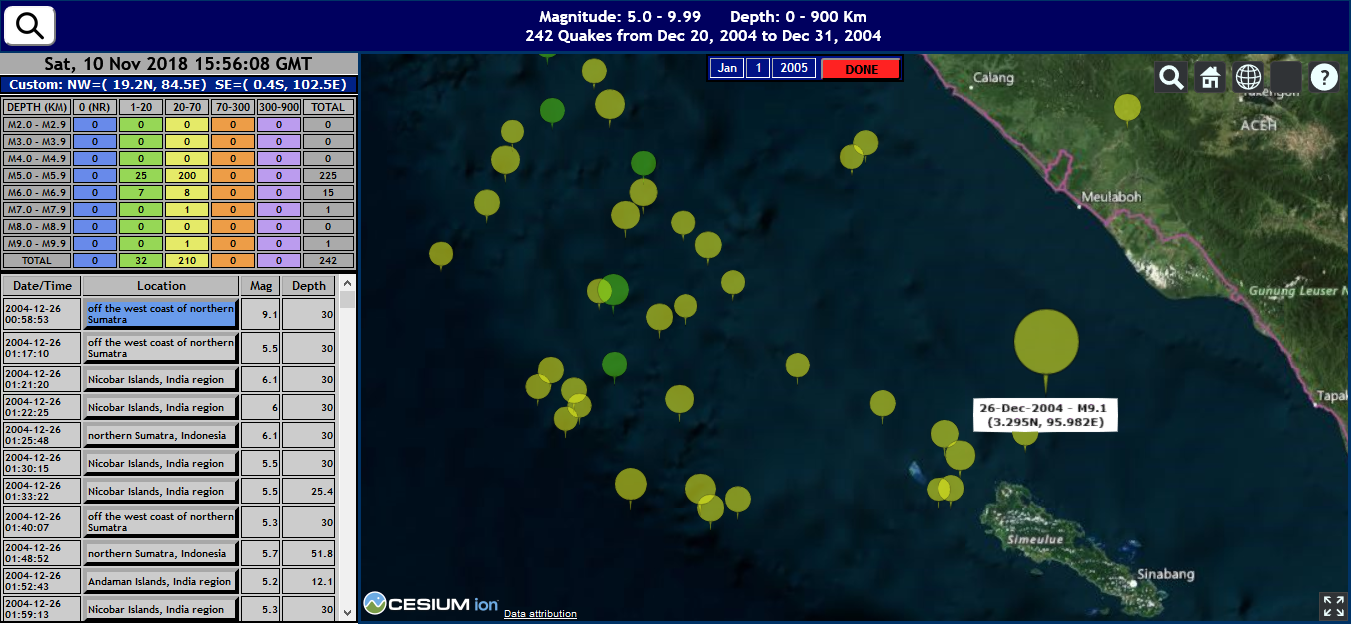
Sumatra 2004, Initial Quake and Aftershocks
EQTrace utilizes the USGS Application Programming Interface (API) to access the USGS repository: https://earthquake.usgs.gov/fdsnws/event/1/
The query is defined in the following table:
| URL | https://earthquake.usgs.gov/fdsnws/event/1/query? |
| Format | csv (Comma-Separated Values) |
| Start Time | Date-Time-Group formatted as 'YYYY-MM-DDTHH:MM:SS'. User-specified, if Calendar is chosen, otherwise derived from the current date-time in UTC. |
| End Time | Date-Time-Group formatted as 'YYYY-MM-DDTHH:MM:SS'. User-specified, if Calendar is chosen, otherwise the current date-time in UTC. |
| Minimum Magnitude | Lower magnitude value on the Moment Magnitude Scale (MMS) |
| Maximum Magnitude | Upper magnitude value on the Moment Magnitude Scale (MMS) |
| Minimum Depth | Epicenter shallower depth value with respect to Earth surface, in Kilometers |
| Maximum Depth | Epicenter deeper depth value with respect to Earth surface, in Kilometers |
| Minimum Latitude | The southern boundary limit of geographic range, if a pre-defined or custom geographic region is selected, or the default southern latitude if not. |
| Maximum Latitude | The northern boundary limit of geographic range, if a pre-defined or custom geographic region is selected, or the default northern latitude if not. |
| Minimum Longitude | The western boundary limit of geographic range, if a pre-defined or custom geographic region is selected, or the default western longitude if not. |
| Maximum Longitude | The eastern boundary limit of geographic range, if a pre-defined or custom geographic region is selected, or the default eastern longitude if not. |
| Order-by | Time ascending (earliest to latest date, in order) |
| Type | "earthquake" |
| Limit | 2500 (maximum number of records to retrieve) |
| 2D Map Displays | Google Map Developer API: https://cloud.google.com/maps-platform/maps/ |
| 3D Map Displays | Cesium JS: https://cesiumjs.org/ |
| Application icon | Freepik: https://www.flaticon.com/free-icon/locations_645692 |
| Sortable table columns | Kryogenix: http://www.kryogenix.org/code/browser/sorttable/sorttable.js |
Thanks to Tom Wible, who pointed me (indirectly) to the USGS site where the data is available for download (see http://flowingdata.com/2014/04/15/mapping-a-century-of-earthquakes/)
The basic idea for the transient display circles came from the Google Maps tutorials at https://developers.google.com/maps/tutorials/visualizing/earthquakes#circle_size